Color Curve Editor
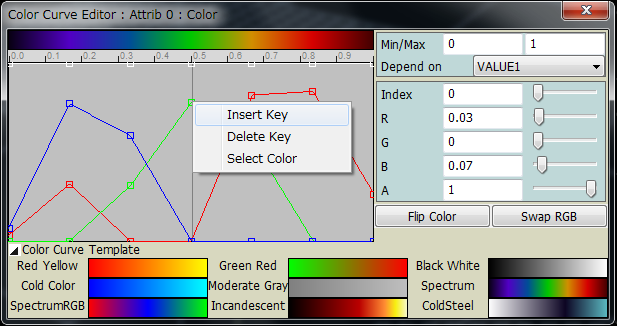
This dialog allows you to configure color curve.

You can edit R,G and B component respectively on graph editor panel. The key frames of each component can be dragged by the mouse left button.
The white line represent alpha value, or opacity. You can edit alpha value independently to the color components.
When multiple keypoints are overlapped, dragging one of them have some difficulty.
If you want to control single component, select color component with short cut key "r", "g", "b" and "a".
Active component is shown by fat line.
A pop up menu is called by clicking mouse right button. You can insert or delete key frames with the menu.
"Select color" calls system-dependent color selection dialog, and insert key fraes with the color choosed.
The color depends on parameters described in Data Loader Dialog
Min and Max parameters determine the scale of color curve.

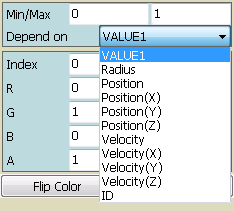
You can select the target of colar curve dependency. The default target is VALUE1.
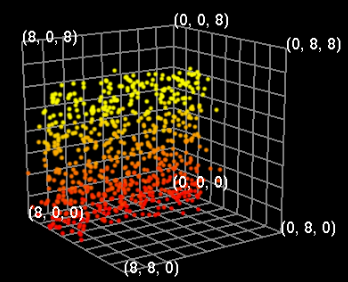
Following figure is an example of a figure with dependency on Position(Z).

For technical reason, you can not set two or more dependency simultaneously other than VALUE1 and Radius.
i.e. you can not set dependency like that color of Attrib 0 depends on Vx and color of Attrib1 depends on Vy.
You can Flip, or exchange RGB color components by the buttons "Flip Color" and "Swap RGB".
You can select color curve from template list.
You can hide the list by clicking the left triange.
return


